3 Advanced Usage
This section provides details on the advanced usage of the nbc4va package which includes training a NBC model, evaluating NBC model performance, and plotting the top predicted causes from the NBC model.
The documentation written here is intended for users of R that understand the different data structures of R such as:
It is also required to understand the basic data types:
3.1 Training a NBC Model
Run the following code using nbc() in a R console to train a NBC model:
library(nbc4va)

# Create training and testing dataframes
data(nbc4vaData)  # example data
train <- nbc4vaData[1:50, ]
test <- nbc4vaData[51:100, ]

# Train a nbc model
# The "results" variable is a nbc list-like object with elements accessible by $
# Set "known" to indicate whether or not testing causes are known in "test"
results <- nbc(train, test, known=TRUE)

# Obtain the probabilities and predictions
prob <- results$prob.causes  # vector of probabilities for each test case
pred <- results$pred.causes  # vector of top predictions for each test case

# View the "prob" and "pred", the names are the case ids
head(prob)
head(pred)
3.1.1 References for Training a NBC Model
See the Methods section for the NBC algorithm details.
For complete function specifications and usage of nbc(), use the code below in an R console:
library(nbc4va)
?nbc
3.2 Evaluating a NBC Model
Run the following code using summary.nbc() in a R console to evaluate a NBC model:
library(nbc4va)

# Create training and testing dataframes
data(nbc4vaData)
train <- nbc4vaData[1:50, ]
test <- nbc4vaData[51:100, ]

# Train a nbc model
results <- nbc(train, test, known=TRUE)

# Automatically calculate metrics with summary
# The "brief" variable is a nbc_summary list-like object
# The "brief" variable is "results", but with additional metrics
brief <- summary(results)

# Obtain the calculated metrics
metrics <- brief$metrics.all  # vector of overall metrics
causeMetrics <- brief$metrics.causes  # dataframe of metrics by cause

# Access the calculatd metrics
metrics[["CSMFaccuracy"]]
metrics[["Sensitivity"]]
View(causeMetrics)
3.2.1 References for Evaluating a NBC Model
See the Methods section for definitions of performance metrics and terms in the output.
For complete method specifications and usage of summary.nbc(), use the code below in a R console:
library(nbc4va)
?summary.nbc
3.3 Plotting the Top Predicted Causes
Run the following code using plot.nbc() in a R console to produce a bar plot of the top predicted causes:
library(nbc4va)
# Create training and testing data
data(nbc4vaData)
train <- nbc4vaData[1:50, ]
test <- nbc4vaData[51:100, ]
# Train a nbc model and plot the top 5 causes if possible
results <- nbc(train, test, known=TRUE)
plot(results, top=5)
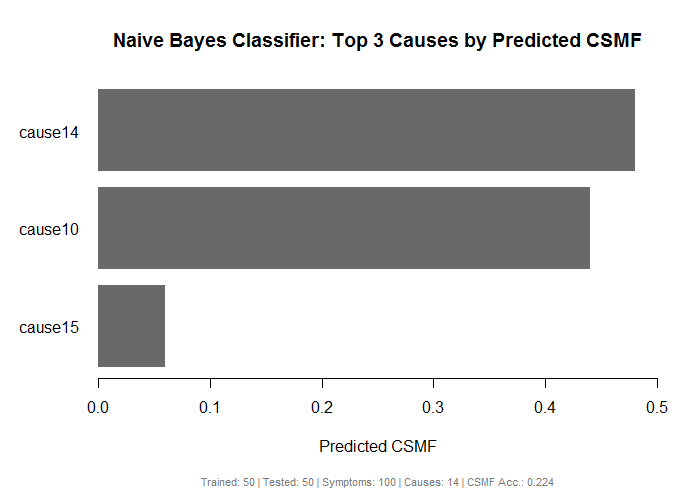
plot(results, top=5, footnote=FALSE) # remove footnote3.3.1 Example of Plotting the Top Predicted Causes
The image below shows a plot of the top causes of death by predicted CSMFs using plot.nbc() on a NBC model trained using the example data nbc4vaData included in the package.
3.3.2 References for Plotting the Top Predicted Causes
See the Methods section for definition of CSMF and related metrics in the footnote of the plot.
For complete method specifications and usage of plot.nbc(), use the code below in a R console:
library(nbc4va)
?plot.nbc